AAF Wealth Management Q1 2022 Market Update
Hope springs forth eternal
What a difference a year makes! Twelve months ago, the advent of Spring promised both warmer weather and increased hopes of widespread availability of COVID vaccines. Optimism was renewed as we began in earnest to look forward to resuming life as normal.
Fast forward one year: the news continues to improve as it pertains to understanding and dealing with the healthcare aspect of the pandemic. What has emerged in the wake of intermittent lockdowns, supply chain disruptions, and rising inflation, though, is the extent of economic damage that was wrought upon the world as we took emergency measures to stem widespread infections. As it turns out, we are efficient at shutting down the world’s economy; restarting it, however, is proving to be a more difficult task than imagined.
In this quarterly update, AAF Wealth Management takes a look at where the U.S. economy stands at present, and explains how we are adjusting portfolios to accommodate varying outcomes. As economic caution signs begin to flash ‘yellow,’ we assess positive and negative factors that impact the markets and factor them into portfolio design and expectations.
Neither a borrower nor a lender be.
We start our assessment of the current economic environment with a review of current news headlines: interest rate yield curves. A quick primer may be in order for those not intimately familiar with the concepts of yield curves, interest rates, and how they impact society at large.
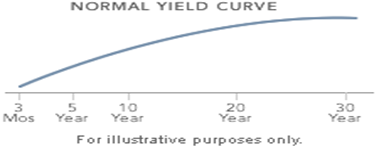
With all due respect to Polonius in William Shakespeare’s play Hamlet, borrowing, lending, and the extension of credit is the necessary lifeblood of economic growth as both governments and businesses rely upon cash infusions to carry out policies and conduct business. To entice investors to provide capital, interest is paid at rates that reflect both expectations of growth in the short and longer term. Creditors (i.e., investors) are generally rewarded with more interest the longer they are willing to lend their money. As such, a ten-year loan should logically pay more interest than a two-year loan, given the extended timeframe one parts with their capital. A yield curve, then, is nothing more than the compilation of interest rates being paid over an extended timeframe.

In contrast to the “normal” yield curve pictured above, there are times when the curve “inverts,” meaning that investors are paid more interest to lend money at two years, than “say” ten years. In other words, picture the slope of the line moving downward from left to right in the prior graph. Historically speaking, an inverted yield curve has been a somewhat reliable harbinger of recession as it basically speaks to society’s belief that economic growth is less robust farther out in the future than in the nearer term. Today, we find ourselves with a somewhat confusing yield curve, as parts have inverted (five years vs. thirty years), but others aren’t quite there yet on a sustained basis (2s & 10s). As with everything, the devil is in the details, and a “fairly reliable” indicator is anything but a guarantee of what may transpire in the future.
To be or not to be, that is the question.
In the U.S., the Federal Reserve has begun hiking the Federal Funds Rate, reducing bond buying in the open market, and may start allowing existing bonds held on its balance sheet to roll-off and mature over time. The cumulative effect of these actions would be to increase interest rates across the board, from short to long, and ideally maintain a normal yield curve.
At odds with these various mechanisms to control the rate curve is the growing threat of inflation. With the volume of money introduced to the global economy since March of 2020, we are not necessarily surprised to see the Consumer Price Index hitting highs not seen in forty years. The Fed is walking a fine line between curbing rising prices and raising the cost of capital without pushing the economy into a recession.
As we mentioned earlier, the yield curve can be a fairly reliable predictor of recession, but it’s not fool proof. If we look back over the past 30 years, the yield curve has inverted 28 times since 1990. Of those 28 instances, 22 times the economy slipped into a recession.
It is often said that the most foolish words in the investing community are “It’s different this time.” At the risk of sounding foolish, there are reasons to believe that it may be “different this time.”
A quick look at the current world economy, and more precisely that of the U.S. in particular, shows strong GDP growth of ~4%, a labor market that’s been adding 600k jobs a month on average over the past six months, and an unemployment rate of 3.6% in March. These figures are hardly indicative of a softening economy that would normally suggest recession.
Further, the current business cycle is one of the most unusual that we’ve encountered. As previously mentioned, core and headline inflation measures are at the highest levels witnessed in decades. With those strong readings, much conjecture has been made about the Fed’s ability and willingness to significantly boost the Federal Funds Rates over the next two meetings in May and June.
A final note on yield curve inversions and recessions.
Historically, when an inversion occurs, the timeline between such a move and actual economic downturn has ranged from nine months to three years (in those cases where there was a downturn). With this potentially long lead time, and the Fed embarking upon such extraordinary measures to counteract inflation, there is not guarantee a recession will occur. As such, we actively discourage trying to time the market and worrying about the next recession when it’s not a forgone conclusion.
What is driving inflation?
With all of this talk of interest rates, inflation, and sloping yield curves, the somewhat obvious but overlooked detail remains: without strong growth in consumer appetites, most of these concerns don’t exist. In other words, inflation is normally only a problem when people are spending money on goods and services. And money spending is usually indicative of growth, not recession.
To provide context, we offer a recap of the past two years. When the world effectively shut down in 2020, several notable things occurred:
- The unemployment rate spiked to 14.8% – highest measure since the 1940’s
- Labor force participation rate declined to 60.2% in April 2020 – lowest since the 1970’s
- Demand for energy collapsed – investment in energy dropped 20%
- Global supply chains shifted – not only did consumers demand shift in terms of what and how they purchased, but the methods by the chains operated changed dramatically
Over the past year and half, though, the world has started to get back to some semblance of pre-pandemic “normal.” The unemployment rate has fallen back to 3.6% and the labor force participation rate has moved upward to 62.4%. Couple this resumption of working with numerous governmental stimulus plans in various forms (e.g., moratoriums on rent and student loans, stimulus checks of various flavors, etc…), as well as general pent-up demand by consumers that spent too much time at home, and it is easy to see how consumer spending skyrocketed.
Consider how consumers changed their spending habits during the early days of the COVID lockdowns. Societally, spending shifted more to personal electronic items. In response, semi-conductor companies found themselves producing more chips for things like computers, tablets, and phones than they did for automobiles.
Logically, this made sense. With fewer employed individuals commuting to work, and nearly all vacation and leisure travel cancelled, the need for new automobiles fell dramatically. That is, until we reopened society in 2021, and consumers decided they needed new cars! This sudden shift again in consumer spending combined with a deficit of available chips resulted in new car inventories at historic lows and the largest increase in used car prices ever. This is just one example of the unforeseen consequences of shifting supply chains.
We must also mention the impact Russia’s invasion of Ukraine has had on the world economy and may continue to have over time. While the true impact of the invasion will be felt in terms of lives lost, there are economic considerations that factor into inflation. Between Russia and Ukraine, a significant amount of the world’s wheat, oil, natural gas, and various precious metals will likely never make it to market.
How do investors prepare themselves and their portfolios to weather these issues?
As humans, we naturally look for opportunity and try to avoid pitfall. Unfortunately, investing requires a degree of faith, as it is largely about believing in the future and looking past short-term noise. To paraphrase the legendary investor Peter Lynch, “while everyone has the brainpower to make money in the markets, not everyone has the stomach to do so.”
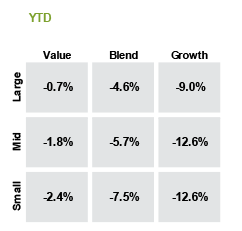
Looking at Q1 2022, nearly every asset class and sub-asset class posted negative returns. The U.S. Bond Market, traditionally a safe haven in the past, generated negative returns of -5.6%, as measured by the Bloomberg U.S. Treasury Aggregate Index. On the whole, U.S. stocks did not fare much better. The best subcategory of equities, Large Value oriented names, lead all other categories with negative performance of -0.7% for the quarter while smaller sized companies with a more growth-oriented posture lost -12.6%. Overall, the growth-oriented names (regardless of market capitalization) underperformed their value competitors across the ledger:

No one can predict with 100% confidence whether a recession is certain, nor how long stocks, bonds, or other investments may under-perform their historical averages.
A recession, by definition, is two consecutive quarters of decline in GDP. Further, recessions happen more often than most people realize, and we always find our way back. Since the founding of our country, the U.S. has encountered 48 recessions, with 12 in the 20th century, and 3 already in the 21st century.
AAF Wealth Management continues to believe in a long-term approach to investing, a well-defined and well allocated portfolio, and approach with the right combination of thought and action. For investors whose window of opportunity to use funds is shorter, it may make sense to think about raising cash to ensure short term goals can be funded. Again, attempting to time the market has extreme risk and rare successes. We advocate for focusing on the long term returns of the market to keep you fully invested.
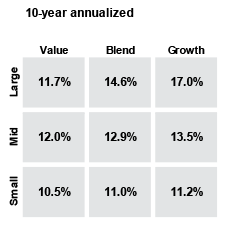
By way of comparison, the chart below is the same chart as above, but the returns depict 10-year annualized returns, effectively providing a glimpse of a full market cycle.

Summary
The American economy has historically proven to be very resilient. Given long horizons, investors generally perform quite well for taking risk and riding through the occasional storm. We certainly have some obstacles to overcome as a society, but there is no reason to not believe in the long-term growth opportunity in the US and world markets.
Despite nervousness investors may feel, people continue to consume and live their lives as they have in the past. With near record low unemployment, large cash cushions in the bank, consumers continue to spend. You may have noticed: flights, hotel rooms, and dinner reservations are more difficult to book. Most recently, Carnival Cruiseline reported its greatest booking demand on record. Many consumers are flush with cash and willing to spend it.
The chart below shows a 45-year history of bank deposits. With COVID-19 came a rush of core bank deposits—generally defined as consumer savings accounts, consumer and business checking accounts, and money market funds. The influx in early 2020 can be traced to companies drawing down credit lines, the distribution of federal emergency stimulus funds, and a slowdown in consumer spending. Although deposit growth has slowed recently as the economy has improved and consumers have resumed spending, many banks remain flush with low-cost funding at a time when loan demand remains tepid and returns on other investment opportunities remain low. This cushion will likely help soften adverse effects of an economic slowdown.

Access Your Quarterly Report
We encourage you to analyze your portfolio of investments at the end of every quarter. To access your quarterly report online, and to see your current investment data, please CLICK HERE (or visit aafwealthmanagement.com and click “Client Portal” in the top navigation). If you do not have access to AAF Wealth Management’s secure web portal, and would like to have access to your quarterly reports online, please contact me or Cheryl Melendy at 774.512.4085, cmelendy@nullaafwealth.com.
Thank you again for the opportunity to be of service.
*AAF Wealth Management is a Registered Investment Adviser. Advisory services are only offered to clients or prospective clients where AAF Wealth Management and its representatives are properly licensed or exempt from licensure. This blog is solely for informational purposes. Past performance is no guarantee of future returns. Investing involves risk and possible loss of principal capital. No advice may be rendered by AAF Wealth Management unless a client service agreement is in place.
